About Comparea
Comparea lets you compare the area of two geographic features (continents, countries, states). Because of the projection that Comparea uses, this comparison is valid (the size of the features is proportional to their area) and suffers from minimal distortion. This lets you see just how big Greenland or Alaska really is.
How it works
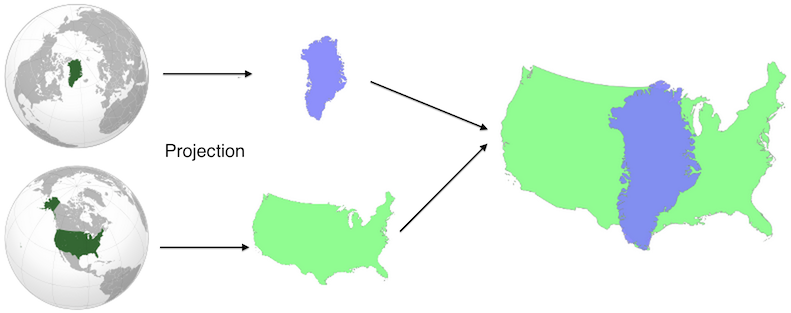
Comparea uses two Albers Equal Area conic projections, centered on the centroids (centers of mass) of the two features. Because the Albers projection is conformal (equal area) and the two projections use the same scale, this results in a valid area comparison. And because the Albers projection minimizes distortion around its center, the feature won't be too badly mangled. This is especially true for small features, though you can see some distortion around the edges of large features.
Intuitively, you can imagine that comparea takes two globes and rotates the two features to the center of each. It then applies the projections and superimposes the resulting shapes:
Background
The idea for Comparea came when I moved from San Francisco to New York City and wanted to relate new geographic features to familiar ones. I quickly found that, due to the inestimable Natural Earth Data (see below), the “Golden Gate Park vs. Central Park” comparison was quite a bit harder to get at than “California vs. New York”. This led me to sit on my initial demo for a few years. But myriad conversations where Comparea would have been helpful made me realize that I was letting the perfect be the enemy of the good. And so Comparea was released!
Acknowledgements
Comparea is completely dependent on the fabulous Natural Earth Data for feature outlines. Specifically, it uses a combination of:
- Admin 0 - Countries without boundary lakes
- Admin 0 - Details for subunits (e.g. European/Asian Russia, North Cyprus, Somaliland)
- Admin 1 – States, provinces also without large lakes
Feature descriptions come from Freebase, which gets them from Wikipedia.
Feature areas and populations come largely from the CIA World Factbook and the US Census, with a smattering of other sources. A reasonablely thorough effort has been made to ensure that the stated area and population are for the same feature that Comparea shows, but this may not always be precisely true. In general, if you calculate the area of the polygon that Comparea displays, it will differ by no more than 10% from the stated area.
Comparea relies on a few third party libraries and services. Highlights:
- D3.js
- jQuery
- Select2
- Flask
- GDAL
- pyproj
- shapely
- gunicorn
- Cloudflare
- Heroku
Feedback / Contribute
Have a bug to report? A feature to request? File it on github.
Have something you want to tell us about? Fill out our feedback form.
Want to play with the data yourself? Check out the project on github, including the GeoJSON file containing all the shapes, statistics, descriptions and links served on Comparea.
References
"Greenland (orthographic projection)" by Connormah - Own work. Licensed under CC BY-SA 3.0 via Wikimedia Commons.
.svg#mediaviewer/File:Greenland_(orthographic_projection).svg)
"United States (orthographic projection)" by Ssolbergj - Own work, This vector image was created with Inkscape. Aquarius.geomar.de The map has been created with the Generic Mapping Tools: http://gmt.soest.hawaii.edu/ using one or more of these public domain datasets for the relief: ETOPO2 (topography/bathymetry): http://www.ngdc.noaa.gov/mgg/global/global.html GLOBE (topography): http://www.ngdc.noaa.gov/mgg/topo/gltiles.html SRTM (topography): http://www2.jpl.nasa.gov/srtm/ Permission is granted to copy, distribute and/or modify this document under the terms of the GNU Free Documentation License, Version 1.2 or any later version published by the Free Software Foundation; with no Invariant Sections, no Front-Cover Texts, and no Back-Cover Texts. A copy of the license is included in the section entitled GNU Free Documentation License.. Licensed under CC BY 3.0 via Wikimedia Commons.
.svg#mediaviewer/File:United_States_(orthographic_projection).svg)